console.log vs debugger in Node.js
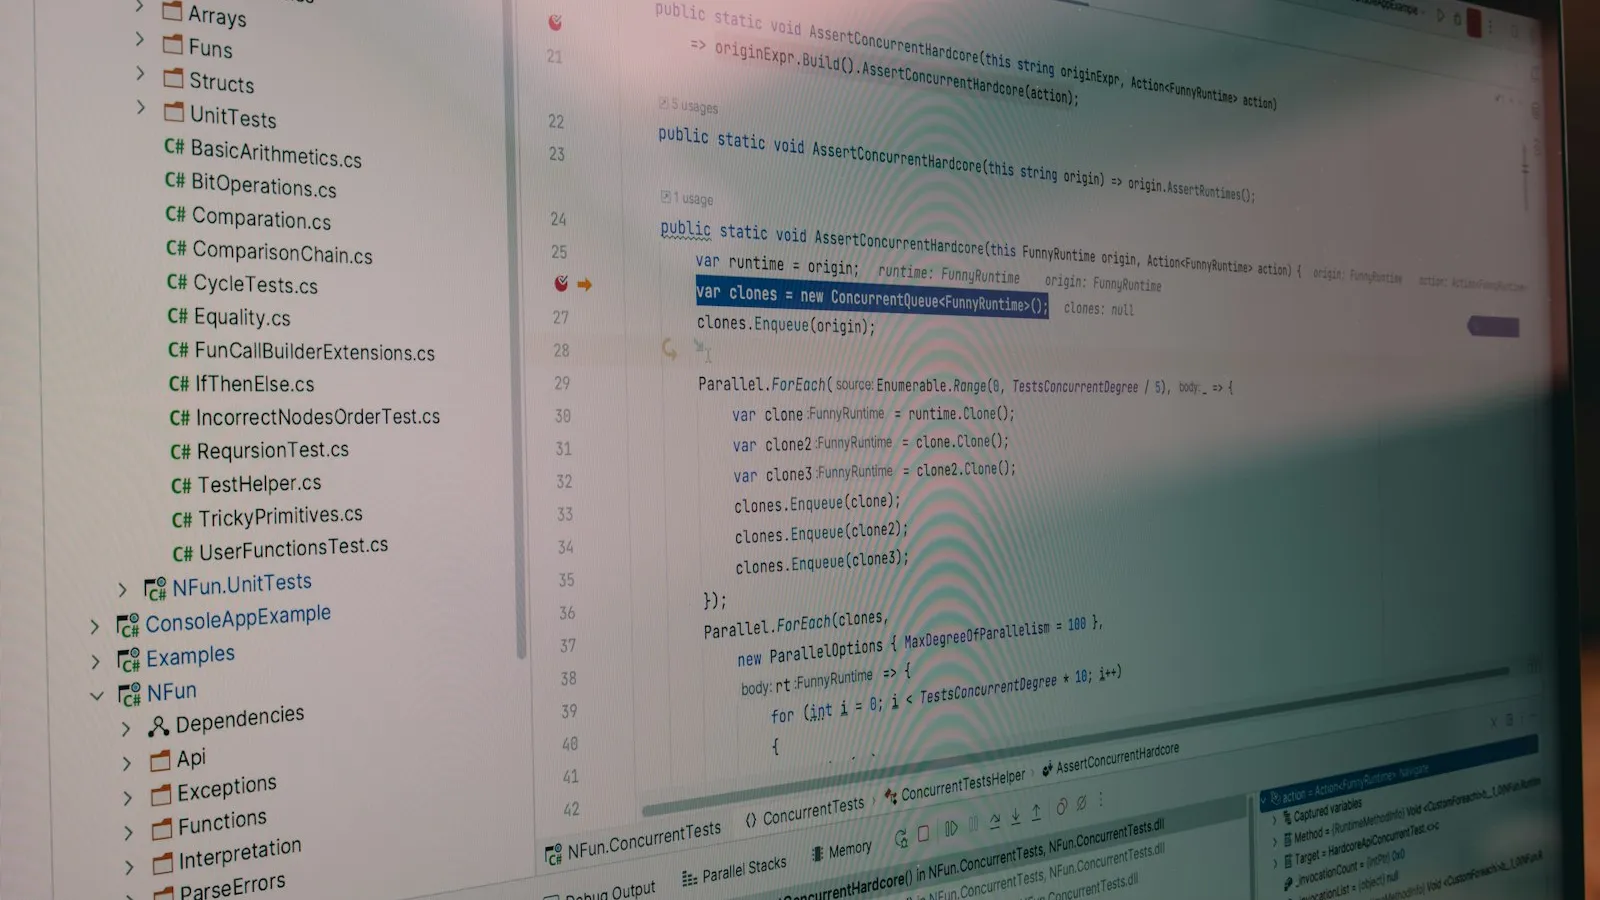
Every time something breaks in a Node.js function, you've got two defaults sitting right there: sprinkle console.log everywhere and read the output, or actually set a breakpoint and step through it. The console.log vs debugger question comes up on basically every project I work on, and most developers default to the first option even when it's quietly costing them more time than it saves. I do it too, more often than I'd like to admit.
This isn't really a "which one is better" question — it's a "which one for this specific bug" question, and the answer changes depending on what you're actually debugging. Here's how I actually decide, with a real comparison instead of the usual "both have their place" shrug.
The real tradeoffs, side by side
Before picking a side, it helps to actually lay out what each approach costs you and what it buys you. I built this table from the bugs I've actually hit, not from a features list:
console.log |
Debugger (breakpoints) | |
|---|---|---|
| Setup time | Zero — type and save | A few seconds to set a breakpoint, or attach --inspect |
| Inspecting deep objects | Painful — nested objects get truncated or print [Object] |
Full object tree, expandable, live |
| Async/await flow | Confusing — logs can print out of order across microtasks | Clean — you step through the actual execution order |
| Conditional bugs ("only fails on the 40th item") | You end up adding if checks around your logs anyway |
Conditional breakpoints do this natively |
| Works in production logs | Yes, if you're using structured logging | No — not meant for production |
| Mental overhead | Low — you already know how to read console output | Higher — you need to actually learn your editor's debugger UI |
| Cleanup required | You have to remember to remove every log line | None — breakpoints don't ship |
That last row is the one that actually bites people. I've shipped console.log('here') to production more times than I want to count, and so has every developer I've worked with. A breakpoint can't accidentally end up in a pull request.
When console.log actually wins
I'd rather be honest here than pretend the debugger always wins, because it doesn't. For a quick "is this function even getting called" check, or confirming the shape of a response object you already roughly trust, console.log is faster. Opening the debugger, setting a breakpoint, and waiting for the process to pause is real overhead when the bug is dumb and obvious.
console.log also wins when you need to see a value change over time, across many calls, without pausing execution — a loop running thousands of iterations, a webhook firing repeatedly, a rate limiter counting requests. Pausing on every iteration in a debugger to watch a counter increment is miserable. For that, I'll reach for console.table() instead of a plain log, which is underused:
function processOrders(orders) {
  const results = orders.map(order => ({
    id: order.id,
    status: order.status,
    total: order.total,
    discountApplied: order.total !== order.rawTotal,
  }));

  console.table(results); // way more readable than console.log(results)
  return results;
}
That one change — swapping console.log for console.table on anything array-of-objects shaped — has saved me more scrolling through terminal output than almost any other debugging habit.
When the debugger actually earns its setup cost
Where console.log genuinely falls apart is anything involving state that changes shape across several steps, or async code where the execution order isn't obvious from reading the source top to bottom. If you're chasing a bug where a variable is "sometimes undefined" and you can't tell which of six call sites is the culprit, a conditional breakpoint beats adding six different log lines with six different prefixes just to tell them apart.
Here's the actual setup I use for Node.js, no extra tooling required:
// orderService.js
async function applyDiscount(order, customer) {
  debugger; // pauses here when running with --inspect-brk, or set a breakpoint on this line in your editor

  const eligible = customer.loyaltyTier === 'gold' && order.total > 100;
  const discount = eligible ? order.total * 0.1 : 0;

  return {
    ...order,
    discount,
    finalTotal: order.total - discount,
  };
}
Run it with:
node --inspect-brk orderService.js
and attach Chrome DevTools (chrome://inspect) or VS Code's built-in debugger. Once you're paused on that line, you can hover customer, expand it fully, change eligible on the fly to test the other branch, and step forward one line at a time — none of which a log statement can do for you.
My actual opinion here, and I know plenty of tutorials disagree: I'd skip console.log entirely for anything involving a loyalty-tier/discount-calculation style bug with multiple branches, because by the time you've added enough logs to cover every branch, you've basically rebuilt a worse version of what the debugger gives you for free. Most tutorials tell you to "just add more logs" as the default — I think that advice is fine for shallow bugs and actively wrong for anything with real branching logic.
The workflow I actually use
In practice I split it by environment, not by preference. Locally, in VS Code, I set real breakpoints for anything involving conditional logic, class state, or async timing — I barely touch debugger; statements anymore since VS Code's gutter breakpoints do the same job without editing the file. In production, there's no debugger to attach to a live server anyway, so it's structured logging the whole way — I use pino over raw console.log on anything client-facing, because JSON logs are searchable in a log aggregator and plain console output isn't.
The mistake I see most often on client codebases isn't picking the wrong tool — it's using only one of them forever and never learning the other. A backend dev who's never set a real breakpoint ends up debugging async race conditions by adding timestamped logs and mentally reconstructing the order, which is a skill, just a slower one than it needs to be.
Frequently Asked Questions
Does leaving console.log statements in my code actually slow anything down?
Barely, for a handful of calls — but if you're logging inside a hot loop or a high-frequency event handler, it adds up, and more importantly it clutters production logs you'll actually need to search later. Strip them before merging, don't just trust yourself to remember.
Why does console.log(someObject) sometimes print [Object] or cut off nested data?
Node's default inspection depth is 2 levels deep. Use console.dir(someObject, { depth: null }) to print the full structure instead of fighting with JSON.stringify.
Can I just leave debugger; statements in committed code?
You can, but don't. Unlike a breakpoint set in your editor (which lives in your local workspace, not the file), a debugger; statement is actual code — if it ships, it'll pause execution for anyone running DevTools against that page or process, which is a bad surprise in production.
Is there a middle ground between the two?
Yes — console.trace() prints a full stack trace alongside your log message, which is genuinely useful for "which caller actually triggered this" bugs without setting up a full debugging session.
Key takeaway
Pick based on the bug's shape, not habit: reach for console.log/console.table for quick checks and anything you need to watch across many iterations, and switch to a real debugger the moment you're dealing with branching logic, async timing, or state you need to inspect more than two levels deep. If you only ever use one of the two, you're debugging with one hand tied behind your back.

Related posts

Debug a Node.js Memory Leak with AI
A practical AI prompt that uses a real heap snapshot retainer path to actually find a Node.js memory leak instead of just confirming one exists.

Node.js 'Headers Already Sent' Error Fix
Node.js's 'Cannot set headers after they are sent' error explained: why it happens, the real fix, and how to stop it recurring in production.

Node.js Worker Threads for CPU-Heavy Tasks
Learn how Node.js worker threads move CPU-intensive tasks off the event loop, with a working Express example and when to pick them over clustering.

Node.js Heap Out of Memory: Causes and Fixes
Fix the Node.js heap out of memory error: raise --max-old-space-size, find the leak with heap snapshots, and stop loading huge files into memory.
0 Comments
No comments yet — be the first to share your thoughts.